By Chris Bayee
It features every type of terrain imaginable, from mountains to beaches and plenty in between. Its weather is the envy of much of the United States. And it boasts the world’s fifth-largest economy.
That begs the question: why are residents moving away from California in droves?
In 2021, the state’s population declined for the first time in its history. That 0.66 percent figure might not sound like much, but consider the nation’s most populous state (more than 39 million residents) lost a net of 244,000 residents. The pandemic also did not help. Per the California Department of Finance, the net loss was 352,000 residents from April 2020 to January 2022.
However, this isn’t exactly an overnight phenomenon. The state’s growth from 2010 to 2020 trailed the nation’s, 5.8 percent to 6.8 percent, according U.S. Census figures. That one percent slide cost California a Congressional seat.
The exodus has been most pronounced near coastal California, which has the most moderate climate and thus is considered the most appealing part. San Francisco and Los Angeles are the top two outbound move cities in the United States (again per the state’s Department of Finance). In the second quarter of 2022 alone, more than 41,000 people moved from Los Angeles.
So, what gives? Here are five contributors to this trend:
The admission price is steep
California’s overall cost of living is daunting.
According to MIT, a living wage for a family of four through any combination of earners would need to be nearly $47/hour. That works out to $97,000 per year. For the same family to live “comfortably,” the annual income must top $135,000 in Los Angeles. In the Bay Area, that estimate climbs $25,000.
Salary.com’s cost-of-living index estimates an L.A. resident must earn 41 percent more than the national average of $78,000 (approximately $110,000), while a San Francisco resident must earn 86 percent more (or $145,000).
The biggest driver of expenses undoubtedly is housing. Consider the National Association of Realtors reporting that in the summer of 2022 the national median home sales price was $416,000. In California it was in excess of $800,000.
A Redfin report in June 2022 estimated that 11 percent of homes in Los Angeles were affordable to a family earning the national average income, and that was when mortgage interest rates were at 3 percent. At the same time, 50 percent of the homes in Phoenix and 78 percent in Houston were within reach. One can only imagine how much more difficult achieving that goal has become now that rates have doubled to above 6 percent.
The car culture

One of the many things California is renowned for is its car culture. On any given day you can see just about any type of car – from classic to custom – on the freeways or while cruising around town.
Part of this fascination likely originates from the fact Californians have to spend so much time in their cars commuting. So, comfort and style are important considerations.
The downside is California has among the nation’s most expensive prices for fuel. According to AAA’s national survey, the national average for a gallon of regular unleaded gas on Sept. 15, 2022 was $3.70. In California, that figure was $5.44. In Arizona, it was $4.02, and in Texas it was $3.18.
Stricter refining requirements and their associated costs are part of the explanation for that price variance, as are gas taxes. Speaking of …
A very taxing state
California is at or near the top of taxation by most measures, and that makes a real dent in the pocketbook.
Consider that the state’s individual tax rate tops out at 13.3 percent, which is the highest in the nation. It also has the highest state sales tax rate (7.25 percent). And the average local sales tax rate is 1.31%. If you’re a single filer making more than $57,824 per year, your rate is 9.3 percent ($115,648 for a couple).
Put another way, if you’re just getting by income-wise, you’re still paying almost 18 percent of your salary in taxes before you even get to social security tax.
Taxfoundation.org has a measure called state-local tax burden, which takes into account state and local taxes paid by a state’s residents divided by that state’s share of the net national product. By that measure California has the fifth-highest state-local tax burden – 13.5 percent ($10,167 per capita) behind New York, Connecticut, Hawaii and Vermont.
Arizona, a popular destination for outbound Californians, has the ninth lowest (9.5) and Texas has the sixth lowest (8.6 percent).
The World Population Review has a weighted tax ranking that takes into account income taxes, sales taxes and property taxes (which are $3,818 per $100,000 in California).
Again, the news is not flattering for the Golden State. California’s 11.56% figure is far higher than No. 2 Minnesota’s 8.96%. Consider Texas’ is 1.88% (No state tax, 6.25 sales tax and property tax rate of $1,993 per 100,000), while Arizona’s is 4.86% (8% income, 5.6 sales, $1,499 property).
The tax burden, combined with the real estate costs, is one that families and individuals must consider.
Educational false start
One path to creating a better life is through education, but the numbers in that category don’t flatter California either.
The national average SAT score, a measure of college readiness, is 1129. In Minnesota, the national leader, that average is 1295. California’s average is 1055, seven percent lower than the national average and 19 percent below the nation’s leader.
The Nation’s Report Card reports NAEP proficiency, deemed a competency over challenging subject matter. California’s performance is below the national averages there, as well.
In Grade 4, proficiency in math was 34 percent and in reading it was 32 percent, both slightly below national averages. At basic levels, the numbers were 75 percent in math and 63 percent in reading.
By Grade 8, the numbers look bleaker – 29 percent proficient in math and 30 percent in reading. The basic levels were 61 percent for math and 68 percent for reading.
Think about that for a minute. One-third of public-school students enter high school without basic reading skills and 40 percent without basic math skills.
It is no wonder that the number of charter schools in the has grown to 1,300. One in 10 public school students now attend a charter school. The state’s department of education reports another 7.3 percent attend private schools.
More bad news

The crime figures are not encouraging either. We’ll look at Los Angeles and San Francisco as case studies using figures from USA By the Numbers. All figures are per 1,000 residents.
Los Angeles’ overall crime rate is 29.96 (18th highest in cities with more than 500,000 population). Violent crime is 7.44 (above California’s average of 4.4 and the national average of 4). Property crime is 22.51 (vs. 21.3 in the state and 19 nationally). Motor vehicle thefts are 5.49 (vs. 2.45 for the U.S.)
San Francisco’s overall crime rate is far worse at 50.72 although the violent crime rate is 5.63. The significant difference comes with property crime – 45.09, more than double Los Angeles’ figure.
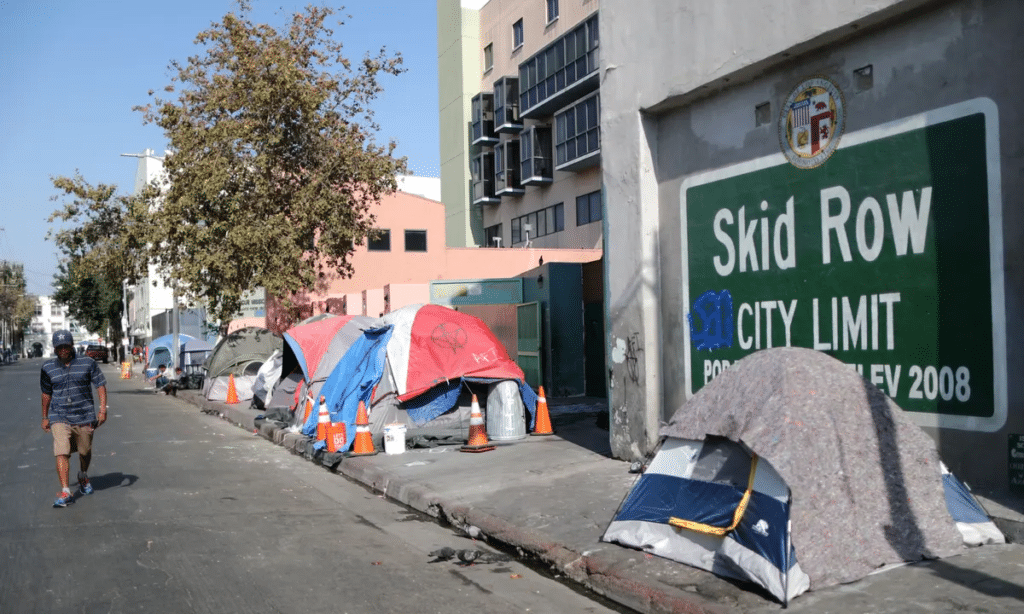
One manifestation of the collateral damage from the costs and crime is the levels homeless are far above anywhere else in the nation.
The United States Interagency Council on Homelessness (USICH) reports California has by far the most, almost 162,000. Texas has 27,000, and Arizona has 11,000.
Add up these factors, and it is clear why some of the luster has worn off the Golden State.


